Common indexes used to reflect stock market performance such as the S&P 500 and the tech-heavy NASDAQ 100 are showing a strong rebound in performance year-to-date. However, the performance of underlying holdings within the indexes continues to vary widely. Year-to-date performance has been concentrated within a select subset of sectors and companies held within the broad indices. In the case of both the S&P 500 and NASDAQ 100, the indexes are constructed of individual companies based on their size as measured by market capitalization, which is calculated as their stock price multiplied by number of shares outstanding. By weighting the index constituents in this manner, the largest companies are given a higher weighting in the index. For example, Apple (ticker: AAPL) has a market cap of approximately $3 trillion (with a t), and reflects a weight in the S&P 500 index of 7.7% and 12.4% of the NASDAQ 100.
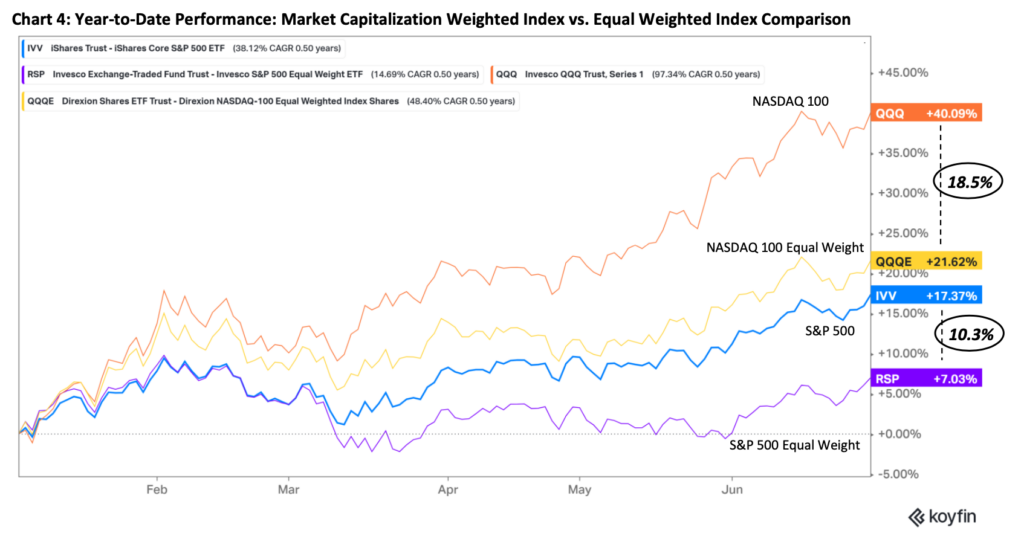
As a result of the construction, performance of the indexes will be heavily influenced by the largest companies. For example, the five largest companies in the S&P 500 index account for nearly 25% of the index. In comparison, the top 10 companies in the NASDAQ account for nearly 60% of the index weight! To contrast the concentrated picture of performance and market breadth these indexes provide, the weights of the underlying companies within the index can be adjusted to be equally weighted rather than based on market capitalization. In this instance, rather than Apple being 7.7% of the S&P 500, it can be reflected as 1/500th of the index, or 0.20%. By making this adjustment, the evaluation of market performance provides a materially different picture as displayed in Chart 4.

It is important to recognize that market capitalization indexes typically do not have restrictions on the weight an individual company can be within an index. Concentration risk, such as holding a large weight of your assets in one position or company, can increase the volatility of your assets over time. Using history as a guide, companies that are the largest by market capitalization size likely do not stay dominant over extended periods of time. While the current breadth of stock market performance has improved, we remain cautious in the near-term direction of the stock market given the recent unbalanced uptrend in performance and continued recessionary pressures on the economy.
Investments may fluctuate in value. Investing involves risk including the possible loss of principal. Past performance does not guarantee future results.
This material contains an assessment of the market and economic environment at a specific point in time and is not intended to be a forecast of future events, or a guarantee of future results. Forward-looking statements are subject to certain risks and uncertainties. Actual results, performance, or achievements may differ materially from those expressed or implied. Information is based on data gathered from what we believe are reliable sources.
4S&P 500 market cap performance measured using iShares Core S&P 500 ETF (symbol: IVV). S&P 500 equal weight performance measured using Invesco S&P 500 Equal Weight ETF (symbol: RSP). NASDAQ 100 market cap performance measured using Invesco QQQ Trust ETF (symbol: QQQ). NASDAQ 100 equal weight performance measured using Direxion NASDAQ 100 Equal Weighted Index ETF (symbol: QQQE). Performance returns provided by Koyfin. www.koyfin.com.
5Index returns are for illustrative purposes only and do not represent actual performance of any investment. Index performance returns do not reflect any management fees, transaction costs or expenses. Indexes are unmanaged and one cannot invest directly in an index. The Standard & Poor’s (S&P) 500 Index tracks the performance of 500 widely held, large-capitalization U.S. stocks. The MSCI All Country (AC) World ex U.S. Index tracks global stock market performance that includes developed and emerging markets but excludes the U.S. The Bloomberg U.S. Aggregate Bond Index is a broad-based fixed-income index used by bond traders and the managers of mutual funds and exchange-traded funds (ETFs) as a benchmark to measure their relative performance
6Index returns provided through Envestnet Tamarac, underlying data provider: Thomson Reuters.

