
Overview
- The Ukrainian conflict has extended the length of economic recovery given supply and demand imbalances along with extending inflationary pressures across the globe.
- A rising interest rate cycle has begun with the Federal Reserve’s recent 0.25% increase in the Federal Funds rate and signals additional rate increases throughout this year.
- International stock valuations remain compelling.
During these last few weeks, we have been reminded of how important and fragile the pillars of freedom and democracy are to society. Taking these liberties for granted has given way to both sadness and anger as we watch events unfold in Ukraine. Never before has a conflict of this scale been broadcast and watched in real-time. Democratic societies across the world have been reminded of the feelings of global conflict last felt some 80 years ago.
Several scenarios exist for the possible outcome of the conflict that range in size, scope, and duration. As we continue to monitor current events and understand short and long-term implications, it is clear that emotional and material discomfort are felt by us all whether through higher food and energy prices or a declining (though recently improving) stock market. It is also evident that the supply and demand imbalance previously initiated with the pandemic lockdowns will continue to cause disruptions in our economy as geopolitics play a larger role.
As a result, inflationary pressures are set to be extended while a resolution is sought to the Ukrainian conflict. Assuming a resolution is found, the difficult task remains of tackling the broader economic supply/demand imbalance. There is also the delicate balance of a tightening labor market and inflation running rampant, The Federal Reserve has initiated a new cycle of interest rate increases starting with the first 0.25% increase in March. We expect continued rate tightening along with the possibility of larger rate increases if rising inflation persists. One item we are closely monitoring is the inversion of the interest rate yield curve. An inverted yield curve happens when short-term interest rates are higher than long-term rates. This action is commonly associated with the belief of investors that further economic growth is uncertain and thus increases the risk of recession. While the risk of recession has increased based on geopolitical events, our view remains that the economy will continue to grow as one-by-one, these issues are resolved.
What has not changed is our expectation of increased daily movement in financial markets, or ‘volatility’. We addressed this in our Annual Outlook and have seen market movements increase throughout the first quarter to above average levels. We expect this to continue based on recent events along with the upcoming midterm election cycle looming.
Also unchanged is our opinion that valuations in international stock markets remain compelling relative to the US domestic market. Continued focus on investment opportunities outside of our borders will remain while we navigate the changing landscape the Ukrainian conflict has presented.
Pulling it all together, an understanding of how your personal assets are allocated is of upmost importance to us. Either direct or through your trusted financial advisor, please know that we evaluate each individual and family member’s situation to determine your willingness and ability to take risk and objectives for growth and income. One intent of this exercise is to avoid either you or us making emotional decisions in the moment that may have a negative impact on your ability to reach your long-term goals.
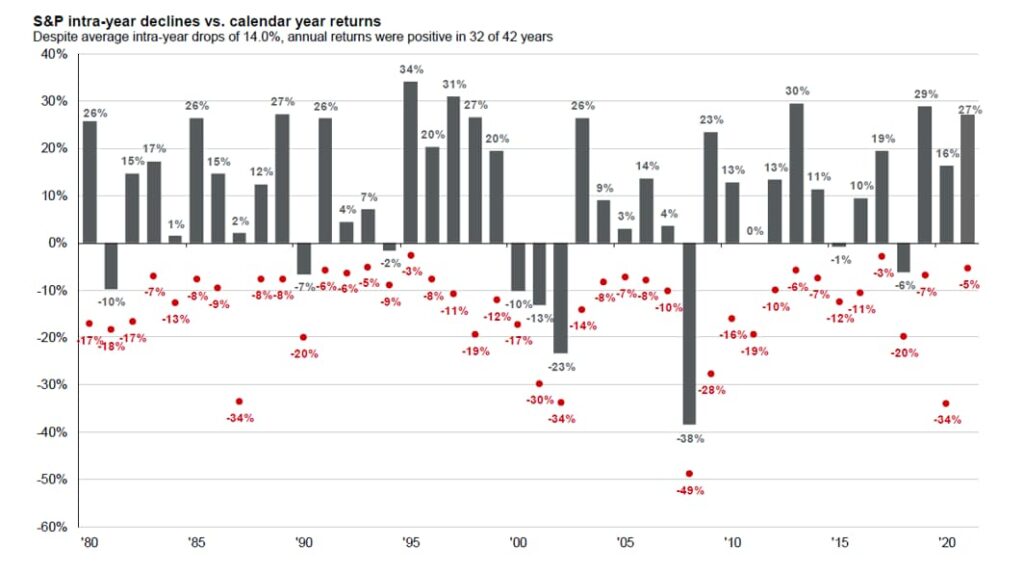
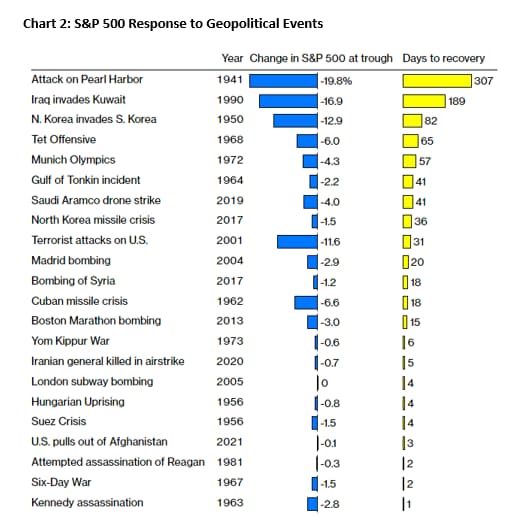
In fact, stock market corrections of the current magnitude typically occur around once per year! Of course, each commonly has its own flavor (Chart 1 below). Global conflicts also vary in financial impact and duration (Chart 2 below). We are here to help steward you through the current events and maintain the path toward your long-term goals. If you feel that your personal situation has changed, please contact us or your outside financial advisor to review the portfolios in greater detail. We should note that despite challenges, the American economy retains strong fundamentals and the broad outline we offered for stocks and bonds in January at our Economic & Market Outlook is unchanged based on the data to-date. Hopefully these two charts provide historical context on current market conditions.
Year-to-date index performance through March 31, 2022:
| Asset Class | Index Name1 | YTD %2 |
|---|---|---|
| US Equity | S&P 500 | (4.6) |
| International Equity | MSCI All Country World Ex-US | (5.4) |
| US Fixed Income | Bloomberg Barclays US Aggregate Bond | (5.9) |
Investments may fluctuate in value. Investing involves risk including the possible loss of principal. Past performance does not guarantee future results.
(1) Index returns are for illustrative purposes only and do not represent actual performance of any investment. Index performance returns do not reflect any management fees, transaction costs or expenses. Indexes are unmanaged and one cannot invest directly in an index.
(2) Index returns provided through Envestnet Tamarac, underlying data provider: Thomson Reuters.