
Overview
- The US economy is showing signs of cooling, suggesting slower growth ahead and could face further potential challenges if demand weakens.
- Returns across asset classes and sectors has varied greatly, and where you are invested matters – a good reminder that it is a market of stocks, not a stock market.
- Missing the best days in markets historically has been proven to be costly; staying invested through volatility is key.
- We expect a choppy trading environment given the current risks that exist in the marketplace.
John F. Kennedy’s observation: “… the one unchangeable certainty is that nothing is certain or unchangeable.”
Economy
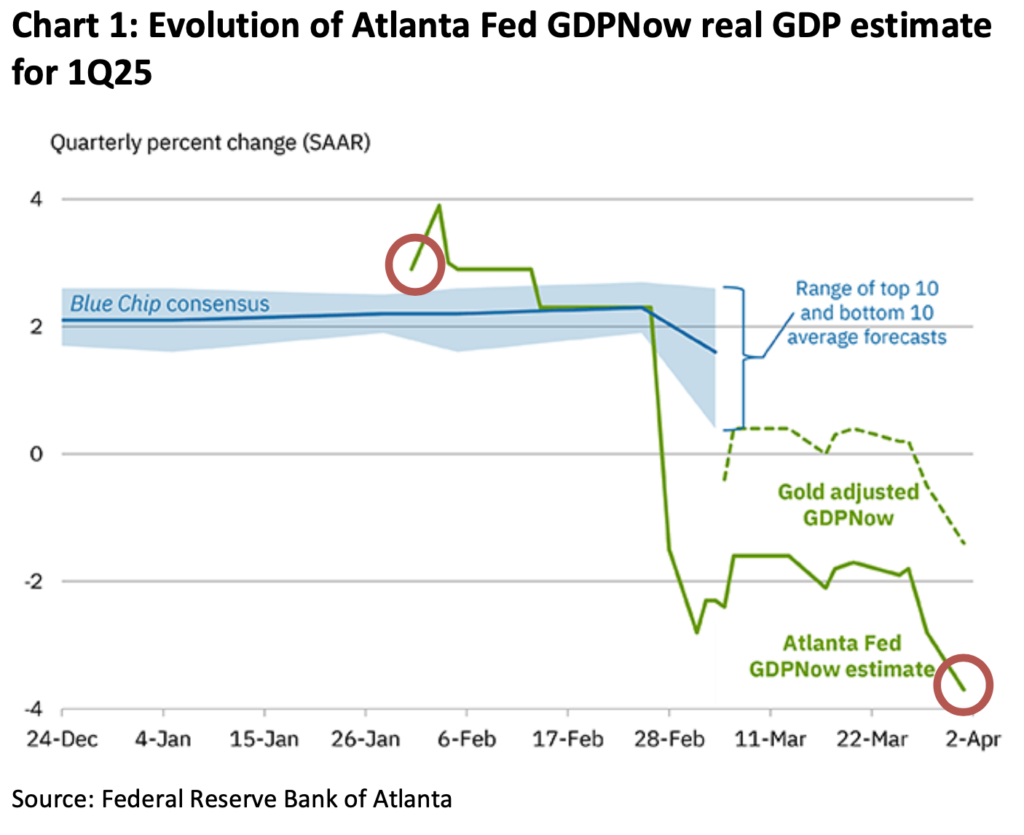
The US Economy is showing signs of rapidly cooling over the past quarter. The Atlanta Federal Reserve’s GDPNow(1) measure, which models economic data such as personal consumption, inflation, net exports and business investment in real time as data is released, is estimating that US real GDP will contract -3.7% in the first quarter, down from -2.8% just a week ago. At the start the year, the model was estimating the economy would grow 2% and has evolved quickly as we moved through the quarter
as illustrated by the green line in Chart 1 below. PCE Inflation has peaked its head again rising to 2.5%, moving further from the Federal Reserve’s long-term target of 2% while unemployment has held steady at 4.1%. Earnings estimates for companies have come down from a growth rate of 14.5% at the beginning of the year to 11.7% (which is still above a long-term average), further reinforcing a slower growth environment.
Recent surveys have measured consumer sentiment dropping, nearing their COVID low levels. When consumer confidence goes down, consumption spending tends to follow trend. When your friends, family or neighbors are being impacted economically or worse starting to losing their jobs, that often spills over in to how we manage our own finances… watching purchases more closely and incrementally increasing our own savings to plan for near-term ‘what if’s’. Roughly two thirds of GDP produced in the US is spending, with the top 10% of consumers accounting for about 50% of consumption. If demand can remain steady, the economy can continue to grow albeit at a slower pace. If it starts to deteriorate, there will likely be further pain felt in the economy and markets. We expect the Federal Reserve to remain cautious in their language and projections, while having a close eye on the unemployment numbers. Current projections anticipate two rate cuts in 2025.
Broadening Markets
Within the US stock market specifically, two sectors have significantly underperformed the rest. Consumer Discretionary and Technology companies have posted negative returns on the year, while all the remaining sectors are flat or positive (Chart 2 below). As of quarter-end, these two sectors make up approximately 40% of the overall US stock market.
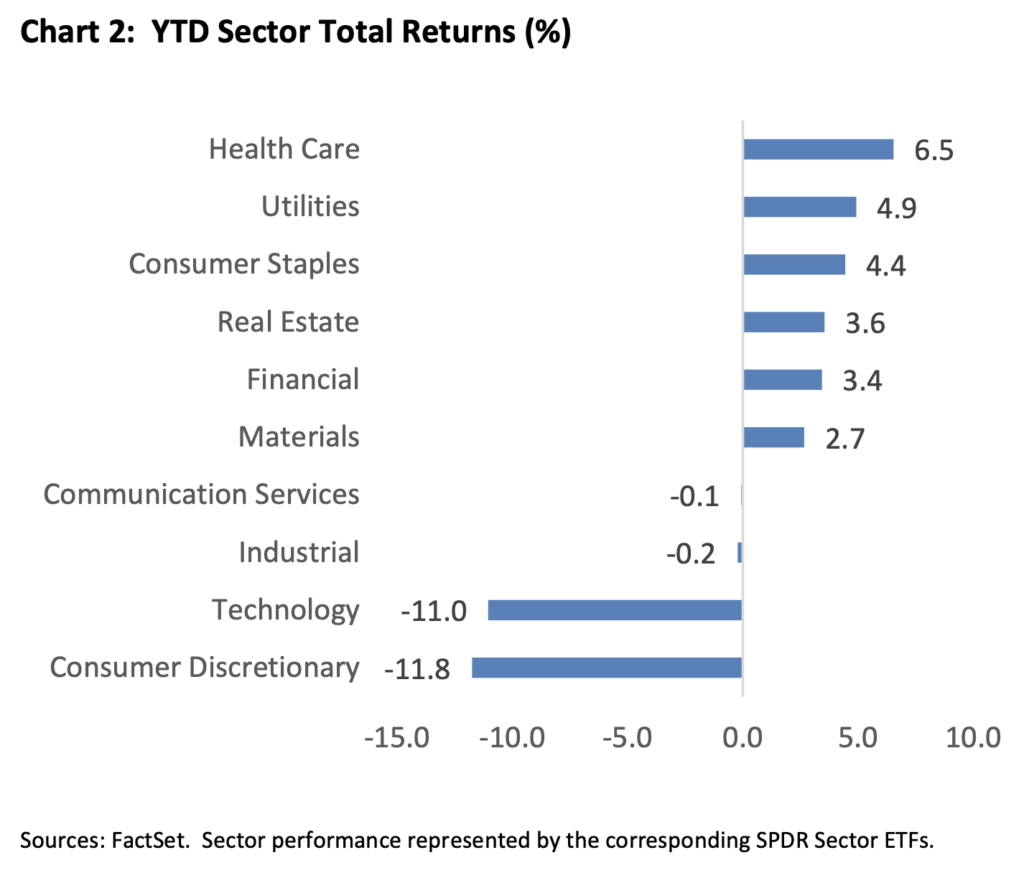
The recently coined Magnificent 7(2) stocks, which are companies primarily within the Consumer Discretionary and Technology sectors, have a large impact on the broader index returns, simply due to the scale at which they hold representation within the index. When these companies do well, the markets do well. When they don’t, the market feels the impact. If you were to rank the companies within the S&P 500’s returns from highest to lowest year-to-date, you would have to go down 266 companies to reach the first Magnificent 7 company, Meta Platforms, with the other six among the lowest performing stocks year to date. A position vastly different than the dominant market leadership they displayed in 2024. Our portfolios have less exposure to these companies than the index, which has been additive to performance this year.
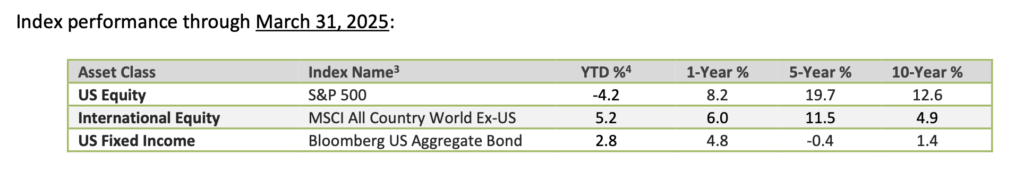
When looking outside of US large cap stocks, small and medium sized companies have also struggled, as the imposition of tariffs weigh on stocks. Outside of the US however, international stocks have rallied with the help of multi decade historically cheap valuations relative to the US, and a declining US dollar. This year has been a good reminder for investors on the importance of maintaining diversified strategies within their portfolios. See Chart 3 below for returns for different asset classes.
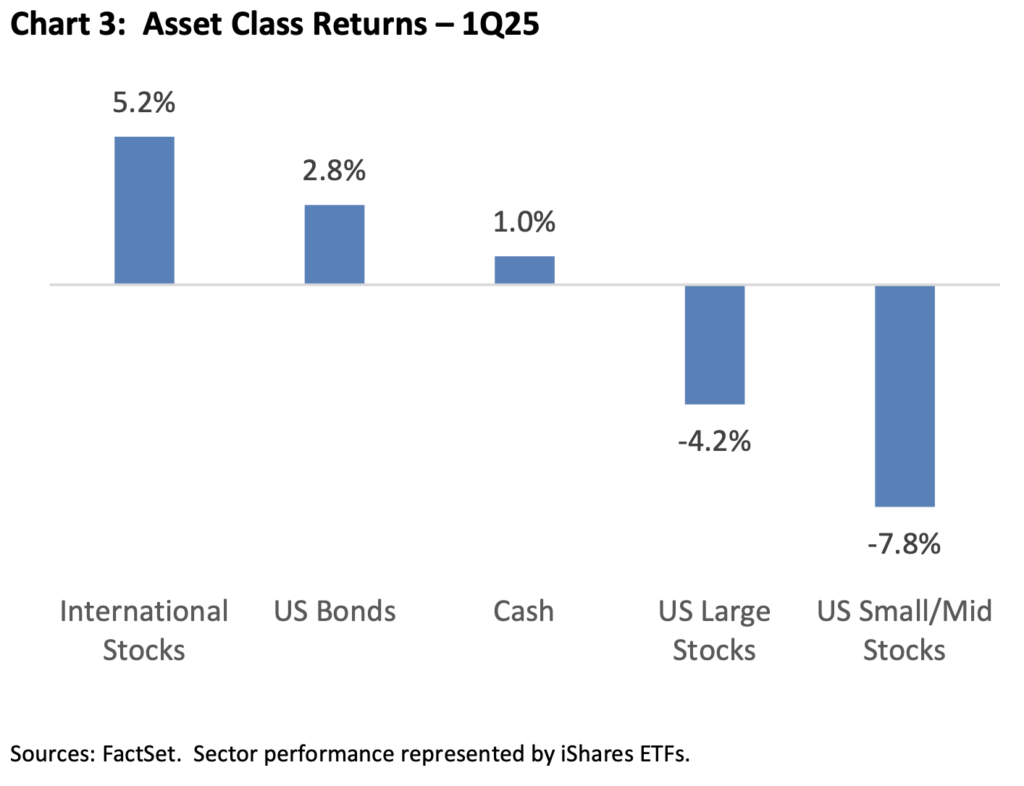
A bright spot within client portfolios this year so far has been bonds. A healthy average coupon payment and downward pressure on interest rates have aided in the US Aggregate Bond index posting a year-to-date total return of 2.8%. Where appropriate within client portfolios for those who have investment objectives that include bonds, we have maintained a slightly shorter duration than benchmark (currently ~6 years), while focusing on areas of the market that we feel will give us a little edge while spreads remain tight, such as in mortgage-backed securities and emerging market bonds. Bonds have returned to being a ballast in portfolios offsetting the negative returns from stocks to start the year.
Investing Fundamental:
Staying invested and maintaining a diversified portfolio remains critically important over time. Missing the best days in the markets historically has proven to be costly to the overall returns of investment portfolios. As you can see in Chart 4 below, missing even the best 10 days yielded a 54% lower total return than if investors stay fully invested.
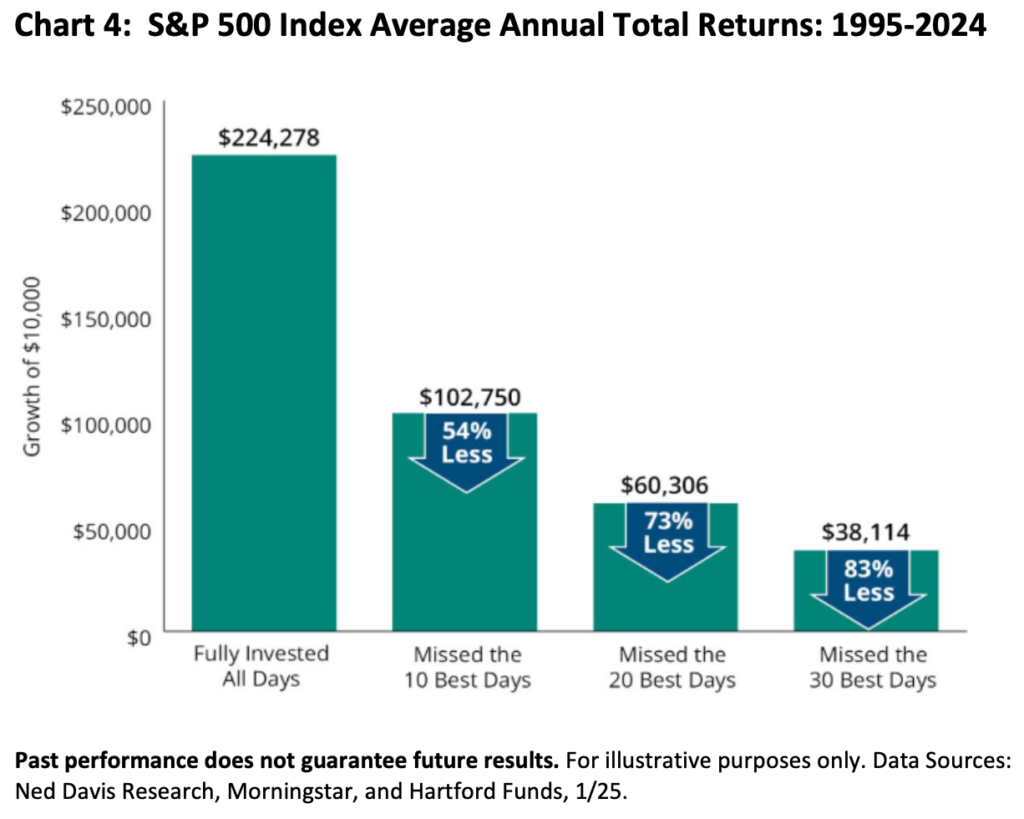
Markets experience periods of time where the up and down price movements get more extreme and can last for weeks on end, but sticking with your strategy through the fluctuations generally leads to better outcomes over time. Oftentimes, the best performing days occur right after the worst performing ones, and 50% of the time, the best days occur in bear markets.
Moments like these are timely reminders to stay focused on your long-term goals and not let short-term movements dictate your investment strategy.
In Closing
In January, our panel discussed how the magnitude and sequence of the administration’s proposed policies would matter a great deal. The implementation of tariffs at varying degrees has brought a meaningful amount of uncertainty to the current environment, and with that, market movements up and down (otherwise known as volatility). Companies with higher valuations relative to the market tend to experience more price change than the average stock when volatility is elevated.
Despite the negative return year to date in major US indices, the average stock in the US market has positive returns to begin the year – a good reminder that it is a market of stocks, not a stock market. With earnings season upon us, we will start to glean insight from company management teams on the state of the consumer and how they are planning for the impacts of tariffs and other anticipated policies coming their way. A positive backdrop from earnings and company guidance may provide a buffer to the economic drag tariffs are imposing. Capital spending plans (investments made for future growth opportunities) tend to be decided by company’s management teams years in advance and may not slow considerably unless the economy and markets fall upon more challenging times.
While we still believe preferring US large cap companies over the long run will be appropriate within investment portfolios, we remain flexible in how we approach the path of getting there. We believe having a defensive position in portfolios is appropriate at this juncture, and returning to your long-term asset allocation targets (stock/bond/cash mix) is important as we continue to expect a choppy trading environment given the current risks that exist in the marketplace.
Should you have any questions, please reach out to your Relationship Manager for more information.
Investments may fluctuate in value. Investing involves risk including the possible loss of principal. Past performance does not guarantee future results.
This material contains an assessment of the market and economic environment at a specific point in time and is not intended to be a forecast of future events, or a guarantee of future results. Forward-looking statements are subject to certain risks and uncertainties. Actual results, performance, or achievements may differ materially from those expressed or implied. Information is based on data gathered from what we believe are reliable sources.
1 GDPNow is not an official forecast of the Atlanta Fed. Rather, it is best viewed as a running estimate of real GDP growth based on available economic data for the current measured quarter. There are no subjective adjustments made to GDPNow—the estimate is based solely on the mathematical results of the model.
2 Magnificent 7 stocks include: Apple (AAPL), NVIDIA (NVDA), Microsoft (MSFT), Amazon (AMZN), Alphabet (GOOGL/GOOG), Meta Platforms (META), Tesla (TSLA).
3 Index returns are for illustrative purposes only and do not represent actual performance of any investment. Index performance returns do not reflect any management fees, transaction costs or expenses. Indexes are unmanaged and one cannot invest directly in an index. The Standard & Poor’s (S&P) 500 Index tracks the performance of 500 widely held, large-capitalization U.S. stocks. The MSCI All Country (AC) World ex U.S. Index tracks global stock market performance that includes developed and emerging markets but excludes the U.S. The Bloomberg U.S. Aggregate Bond Index is a broad-based fixed-income index used by bond traders and the managers of mutual funds and exchange-traded funds (ETFs) as a benchmark to measure their relative performance
4 Index returns provided through Envestnet Tamarac, underlying data provider: Thomson Reuters.