
Overview
- Inflation continues to remain sticky. Economic strength is at odds with the Federal Reserve as they signal cutting interest rates 3 times in 2024 (0.25% per cut expected).
- Following the strong stock market performance over the last six months and the memories of high inflation and interest rates during the bear market of 2022, it is important to note that bull markets tend of provide multi-year periods of growth.
- If the Fed moves forward with interest rate cuts in 2024, the move will likely be positive for bond returns.
- Now is the time to review the allocation to cash in your overall portfolio.
Economy
The US economy has continued to remain robust following the rise of interest rates which culminated last July. While this has not been the case for other developed countries across the world, the strength of the domestic economy continues to provide mixed signals as we look forward. The Federal Reserve recently reaffirmed their plans to cut interest rates in 2024. Currently, the Fed anticipates three rate cuts in 2024 (0.25% per cut expected). However, as illustrated below, inflationary pressures in certain areas of the economy continue to provide obstacles to the Fed’s goal of 2% average inflation.
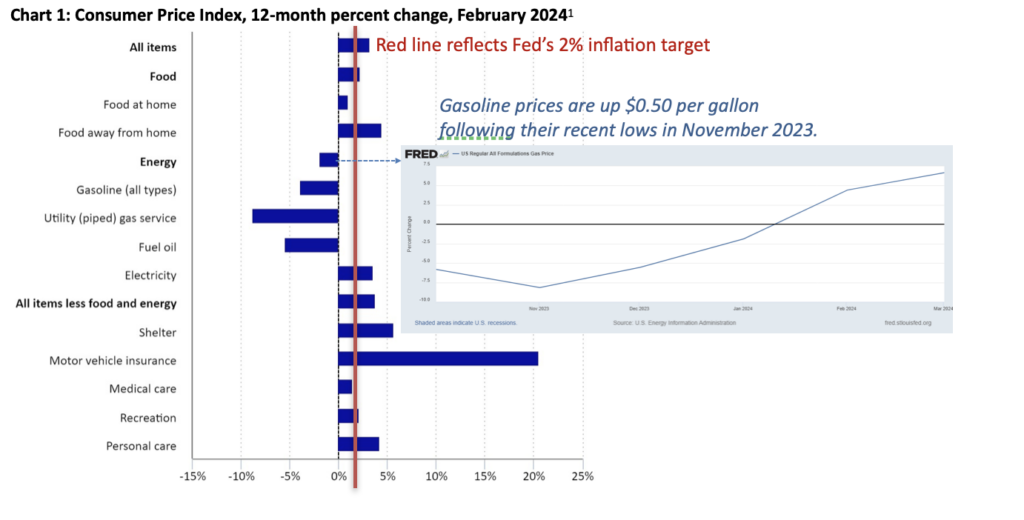
As of the most recent reading, inflation as measured by the Consumer Price Index, nudged slightly higher to an annualized rate of 3.2% versus the 3.1% measured in January. As economic strength continues to remain above expectations, the possibility that the Fed maintains the current level of interest rates at a range of 5.25%-5.50% increases.
Stocks
As the memory of 2022’s lackluster stock and bond market performance begins to fade, what remains is the emotional response during the period of a rapid rise in inflation and corresponding interest rates. Q4 2023 and Q1 2024 have produced strong stock market returns. While it is natural to begin to assess the speed of the recent uptick in performance, arguably driven by a select group of technology focused companies, an important perspective to reflect on is the average length of a bull market. As shown in Chart 2 below, multi-year periods of stock market growth tend to follow bear markets on average. This pattern supports broadening the focus of your investing time horizon.
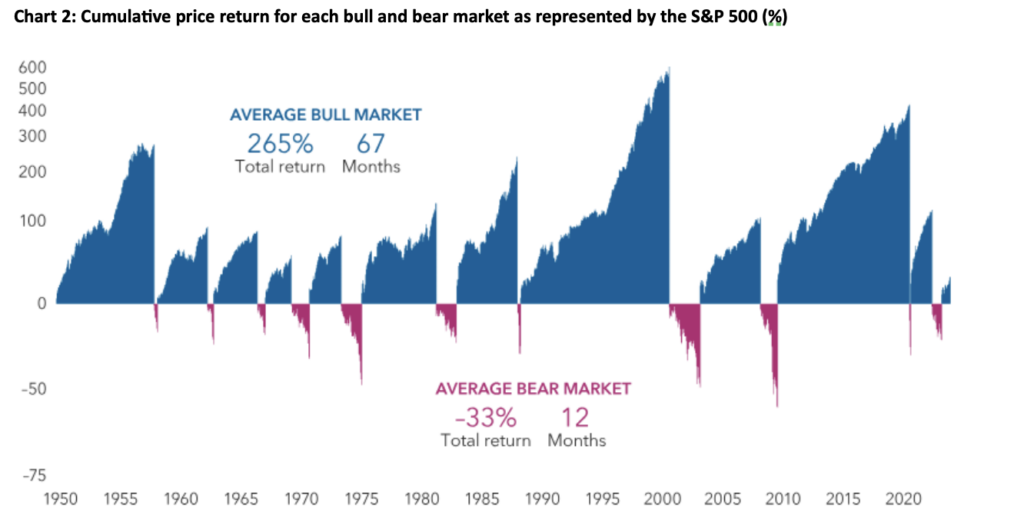
Sources: Capital Group, RIMES, Standard & Poor’s. Includes daily returns for the S&P 500 index from 6/13/49-6/30/23. The bull market that began on 10/12/22 is considered current and is not included in the ‘average bull market’ calculations. Bear markets are peak-to-trough price declines of 20% or more in the S&P 500. Bull markets are all other periods. Returns are in USD and are shown on a logarithmic scale. Past results are not predictive of results in future periods.
Bonds
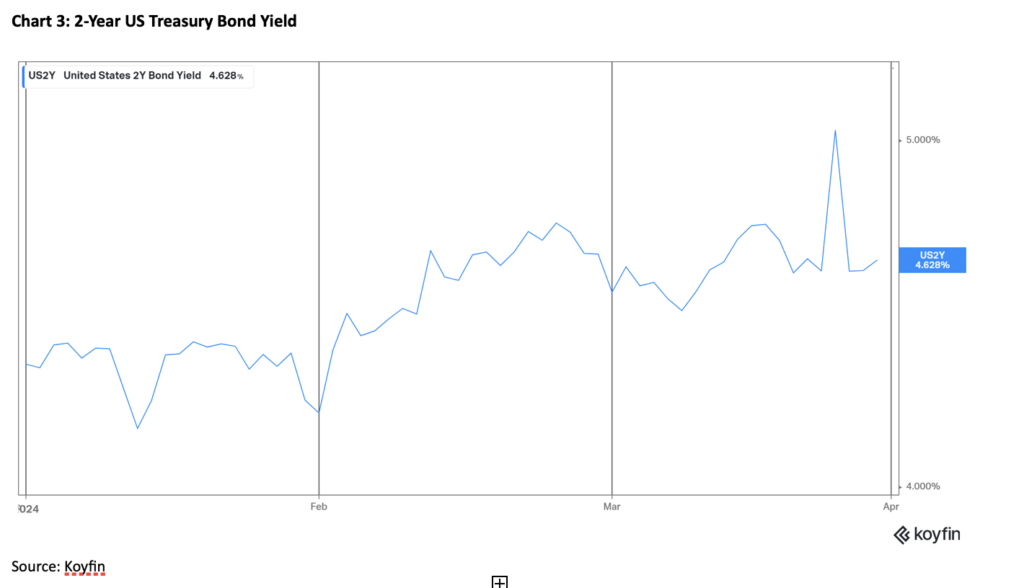
Returning to the Fed’s interest rate policy, if they proceed with interest rate cuts, bond investors will likely be rewarded. Interest rates on bonds, commonly referred to as yields, continue to reflect a potential rate cut by the Federal Reserve. Chart 3 below reflects the current yield on a 2-Year US Treasury Bond at approximately 4.6%. Said another way, the bond market is anticipating interest rates on 1-Year US Treasury Bonds one year from now to be 4.6%. From our starting point today, that would imply interest rate cuts over the next 12-months of approximately 0.75% from their current range of 5.25%-5.50% (current range minus 4.6%).
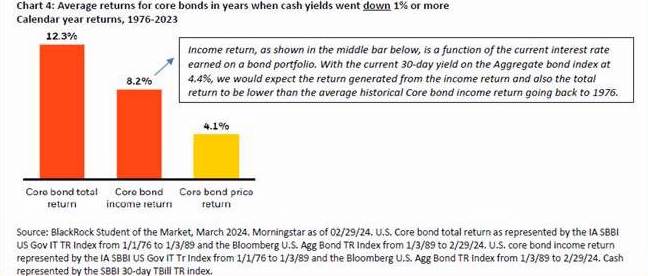
Traditionally, returns on bonds will perform well during periods of declining interest rates. As seen in Chart 4 below, the total return is comprised of two pieces: the interest income from the bond, and the potential increase in price of the investment. The higher interest yielding bond becomes more attractive to new investors as interest rates for similar investments in the market place are lower. For investors that have an allocation to bonds in their accounts, the increase in the weight of bonds in your accounts over the last couple of years has been in anticipation of this cycle.
Cash
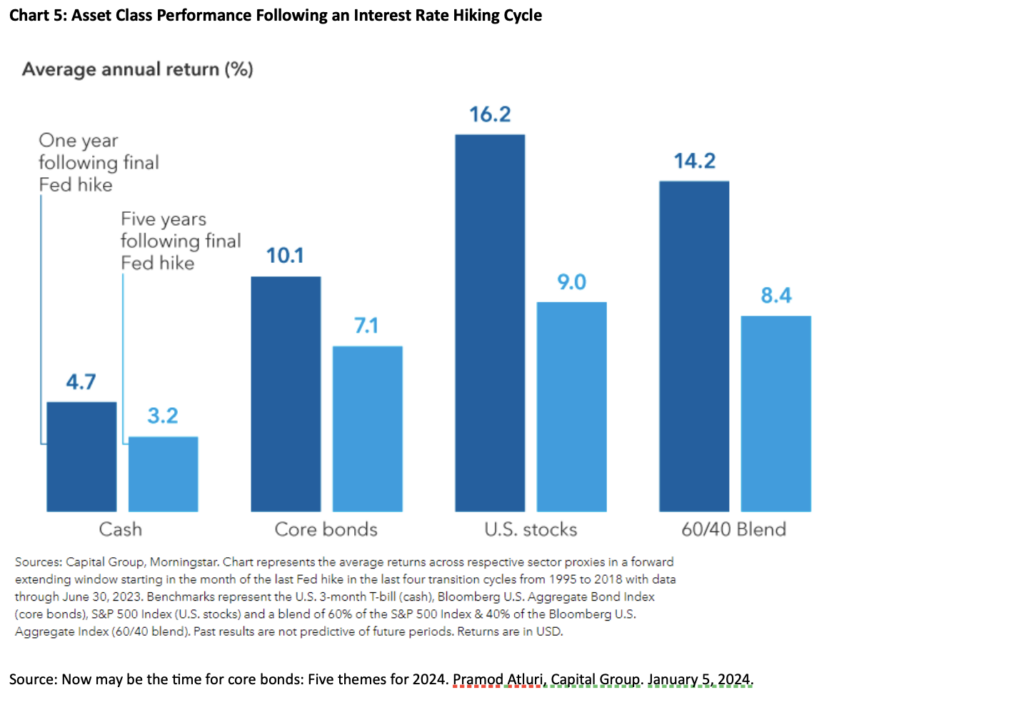
As we have mentioned in previous updates, now is the time to evaluate the allocation of cash in your overall investment strategy. With the Federal Reserve signaling their intent to lower interest rates, the expected return on cash and cash equivalent investments (CD’s, money markets) is likely to be reduced. Historically, returns on cash have underperformed both bond and stock following an interest rate hiking cycle as seen in Chart 5 below.
Summary
As summarized by Charles Schwab’s Chief Income Strategist Kathy Jones on her recent On Investing podcast, the US economy is ‘driving down the road to lower rates, but the speed and destination are still to be determined.’ Please reach out to your investment professional if you have any comments or questions on the updates above. On behalf of our entire team and colleagues, have an enjoyable spring and continue your pursuit of the Freedom to live an inspired lifeTM.
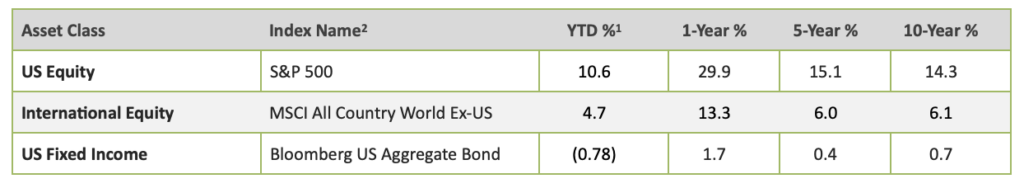
Index performance through March 31, 2024:
Investments may fluctuate in value. Investing involves risk including the possible loss of principal. Past performance does not guarantee future results.
This material contains an assessment of the market and economic environment at a specific point in time and is not intended to be a forecast of future events, or a guarantee of future results. Forward-looking statements are subject to certain risks and uncertainties. Actual results, performance, or achievements may differ materially from those expressed or implied. Information is based on data gathered from what we believe are reliable sources.
The term federal funds rate refers to the target interest rate set by the Federal Open market committee (FOMC). This target is the rate at which commercial banks borrow and lend their excess reserves to each other overnight. The FOMC which is the policymaking body of the Federal Reserve System, meets eight times a year to set the target federal funds rate, which is part of its monetary policy.
1The Consumer Price Index (CPI) for US Urban Consumers is a price index of a basket of goods and services paid by US urban consumers. Percent changes in the price index measure the inflation rate between any two time periods. The most common inflation metric is the percent change from one year ago. It can also represent the buying habits of urban consumers. This particular index includes roughly 88 percent of the total population, accounting for wage earners, clerical workers, technical workers, self-employed, short-term workers, unemployed, retirees, and those not in the labor force.
2Index returns are for illustrative purposes only and do not represent actual performance of any investment. Index performance returns do not reflect any management fees, transaction costs or expenses. Indexes are unmanaged and one cannot invest directly in an index. The Standard & Poor’s (S&P) 500 Index tracks the performance of 500 widely held, large-capitalization U.S. stocks. The MSCI All Country (AC) World ex U.S. Index tracks global stock market performance that includes developed and emerging markets but excludes the U.S. The Bloomberg U.S. Aggregate Bond Index is a broad-based fixed-income index used by bond traders and the managers of mutual funds and exchange-traded funds (ETFs) as a benchmark to measure their relative performance
6Index returns provided through Envestnet Tamarac, underlying data provider: Thomson Reuters.