
3rd Quarter 2023 Investment Update
Craig McCrory, CFA – Partner, Chief Investment Officer
Overview
- The latest meeting of the Federal Reserve resulted in a pause (or skip) in interest rate hikes. While the future path of interest rates is yet to be defined, now is the time to evaluate the percentage of cash held in your portfolio.
- As we evaluate the future direction of interest rates, we will revisit the inverse relationship between bond prices and interest rates.
- Year-to-date stock market performance has been strong for the US market-cap weighted NASDAQ and S&P 500 indexes. However, strong index returns do not reflect the broad stock market performance so far this year.
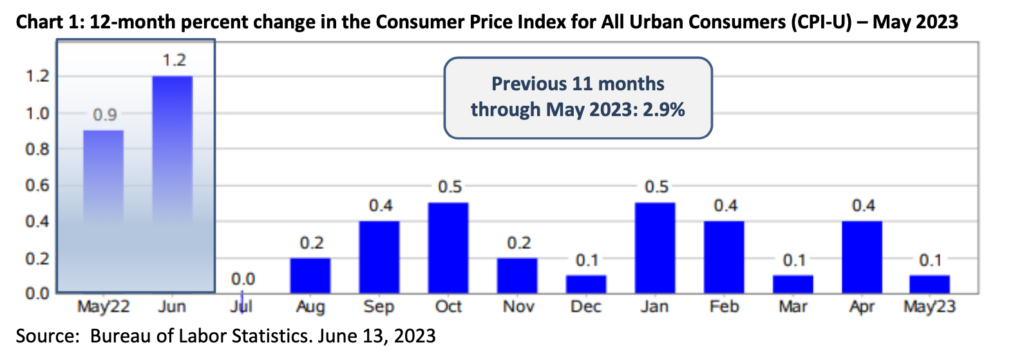
The latest meeting of the Federal Reserve in mid-June produced an action of no action. While the decision to not raise rates was anticipated, the future direction of interest rates remains to be determined. Here in the US, inflation has broadly continued to stabilize. While still above the Fed’s target average of 2%, the evaluation of inflation using the Consumer Price Index (CPI) through June will likely reflect an inflation rate closer to 3% for the previous 12-months as reflected in Chart 1 below.
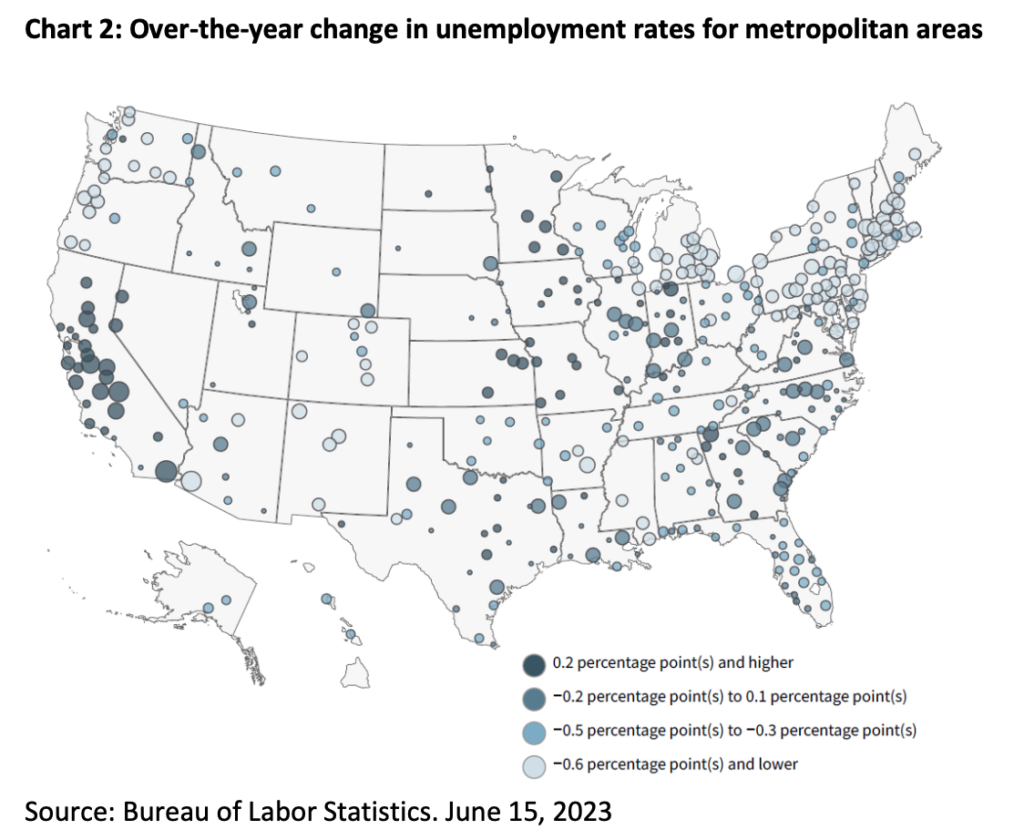
While inflation rates continue to reflect the impact of previous interest rate hikes, the Fed remains on guard. Economic numbers and stock market returns have shown signs of strength anticipating a possible path of interest rate declines. However, what continues to remain sticky is the employment landscape. The low level of unemployment in the US continues to provide support for economic growth. Of primary concern for the Federal Reserve is its impact on the economic engine. Specifically, low levels of unemployment drive demand for higher wages and higher prices. As a result, the Federal Reserve may not be done with interest rate hikes if employment remains strong. As can be seen in Chart 2, the over-the-year change in unemployment rates varies by location. In all, it remains at historically low levels.
The Impact on Interest Income from Cash Holdings
At current levels, interest rates on purchased money market funds are hovering around 5%. As many income-oriented investors have grown increasingly comfortable holding high levels of cash at these rates, now is the time to evaluate how much cash is appropriate to hold in your overall portfolio mix. Our base case scenario is for rates to remain near current levels for the remainder of the year. However, history suggests the next direction of rates is down.
Interest received from cash and cash equivalent holdings such as money market funds and Treasury bills is determined from short-term interest rates. If rates fall, the reinvestment of future cash holdings will result in lower interest income. For example, if you hold a Treasury Bill that matures on June 30, 2024 and rates are hypothetically at 4%, the Treasury Bill available at that point in time for purchase will have a lower interest rate.
What are your options? After identifying and holding aside cash for an emergency fund (at least 3 months of expenses, our preference is 6-12 months) and any known cash needs for the next year, our recommendation is deploying the funds to your investment portfolio. For balanced investors, that would likely include an increased allocation to bonds and stocks. Over the last 6 months, we have been increasing bond exposure across suitable accounts. Importantly, for the increased allocation to bonds, we have also been extending the maturity of the underlying holdings. The reason for this is to purchase bonds with maturity dates further in the future to hold the higher interest rates for a longer period of time under the assumption that short-term interest rates are likely to come down in the next 12 months.
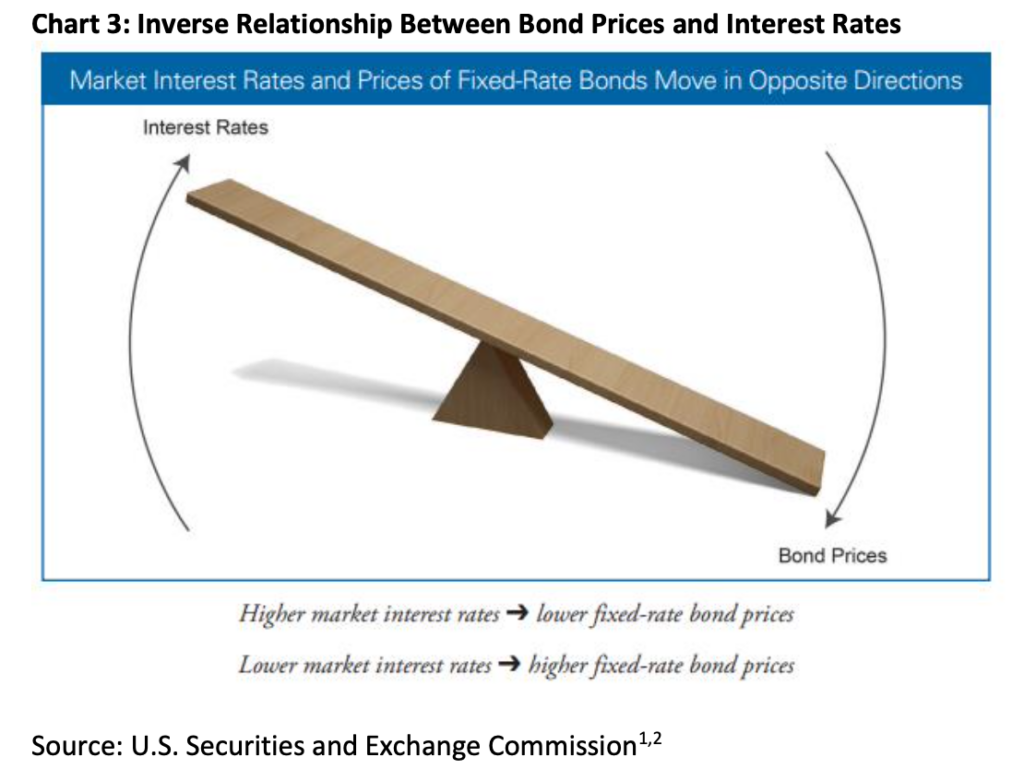
The Inverse Relationship Between Bond Prices and Interest Rates
While on the topic of bonds, we feel it is an appropriate time to revisit a complicated concept: the inverse relationship between bond prices and interest rates. Before we get into an example, let’s define what a bond is. A bond is an investment whereby you are lending money to an entity, typically for a defined period of time, which will pay you a defined amount of interest income. When the time period is complete (the bond matures), the investor will receive their final interest payment as well as the return of their original investment amount (principal).
As an example, let’s assume an investor purchases a bond at its original offering price of $1,000. The bond pays an interest rate of 5% with a set maturity date in 5 years. As such, the investor is expecting to receive $50 of interest income each year from the bond ($1,000 x 5%). After 5 years, the investor will have received $250 in interest income along with their original investment amount returned at the maturity of the bond length.
What happens if during the time of holding the bond, interest rates fall from 5% to 4%? If the investor holds the bond to maturity, nothing will change in terms of the interest payments received or the return of the original investment amount. However, if the investor is open to selling the bond before it matures, things get interesting.
Investors in the market have access to new bonds being issued at the adjusted 4% interest rate at an offering price of $1,000. If our investor owns a bond that is paying 5%, their bond is more valuable to a potential buyer because it is paying 25% more in interest per year than new bonds being issued. As such, a potential buyer would be willing to pay a price higher than the $1,000 offering price to secure a bond with a higher interest rate.
The inverse is also true. If rates rise to 6% from 5%, the investor can hold their bond to maturity with no impact to the current investment. However, if they need to sell the bond for some reason, a potential buyer will offer less than the original offering price of $1,000 because they are able to secure a newly issued bond paying the higher interest rate at an offering price of $1,000.
To visualize the concept, the use of a seesaw is helpful.
Stock Market Index Returns: The Rise of a Few
Common indexes used to reflect stock market performance such as the S&P 500 and the tech-heavy NASDAQ 100 are showing a strong rebound in performance year-to-date. However, the performance of underlying holdings within the indexes continues to vary widely. Year-to-date performance has been concentrated within a select subset of sectors and companies held within the broad indices. In the case of both the S&P 500 and NASDAQ 100, the indexes are constructed of individual companies based on their size as measured by market capitalization, which is calculated as their stock price multiplied by number of shares outstanding. By weighting the index constituents in this manner, the largest companies are given a higher weighting in the index. For example, Apple (ticker: AAPL) has a market cap of approximately $3 trillion (with a t), and reflects a weight in the S&P 500 index of 7.7% and 12.4% of the NASDAQ 100.
As a result of the construction, performance of the indexes will be heavily influenced by the largest companies. For example, the five largest companies in the S&P 500 index account for nearly 25% of the index. In comparison, the top 10 companies in the NASDAQ account for nearly 60% of the index weight! To contrast the concentrated picture of performance and market breadth these indexes provide, the weights of the underlying companies within the index can be adjusted to be equally weighted rather than based on market capitalization. In this instance, rather than Apple being 7.7% of the S&P 500, it can be reflected as 1/500th of the index, or 0.20%. By making this adjustment, the evaluation of market performance provides a materially different picture as displayed in Chart 4.
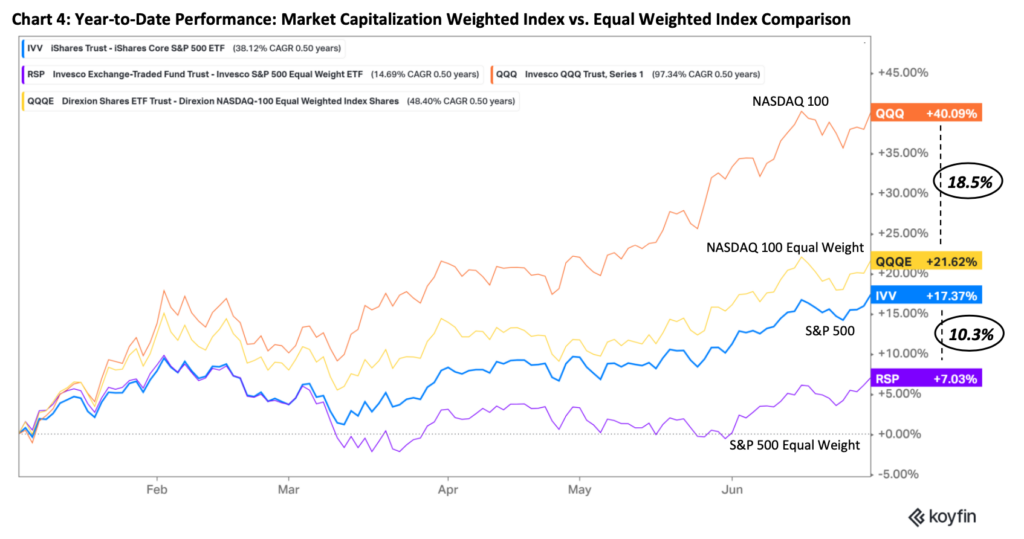
It is important to recognize that market capitalization indexes typically do not have restrictions on the weight an individual company can be within an index. Concentration risk, such as holding a large weight of your assets in one position or company, can increase the volatility of your assets over time. Using history as a guide, companies that are the largest by market capitalization size likely do not stay dominant over extended periods of time. While the current breadth of stock market performance has improved, we remain cautious in the near-term direction of the stock market given the recent unbalanced uptrend in performance and continued recessionary pressures on the economy.
7328 E. Deer Valley Road, Suite 105• Scottsdale, AZ 85255 • (480) 295-7100 F: (480) 513-1458 • cipinvest.com Advisory services offered through Capital Insight Partners, a Registered Investment Advisor. Securities offered through M.S. Howells &Co. Member FINRA/SIPC. M.S. Howells & Co. and Capital Insight Partners, LLC are not affiliated.
Summary
This update in particular has covered a lot of ground. We invite you all to reach out to your investment professional with any questions as it relates to your personal needs. While we look forward to talking to you, we also hope you enjoy the summer doing the things you are passionate about with those you care about most.
Freedom to live an inspired lifeTM.
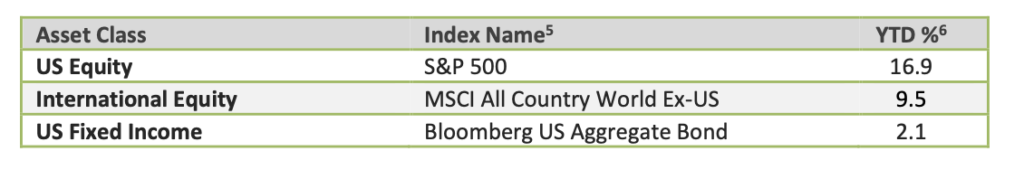
Year-to-date index performance through June 30, 2023:
Investments may fluctuate in value. Investing involves risk including the possible loss of principal. Past performance does not guarantee future results.
This material contains an assessment of the market and economic environment at a specific point in time and is not intended to be a forecast of future events, or a guarantee of future results. Forward-looking statements are subject to certain risks and uncertainties. Actual results, performance, or achievements may differ materially from those expressed or implied. Information is based on data gathered from what we believe are reliable sources.
1: Interest Rate Risk – When Interest Rates Go Up, Prices of Fixed-Rate Bonds Fall. U.S. Securities and Exchange Commission. Office of Investor Education and Advocacy. June 2013. https://www.sec.gov/files/ib_interestraterisk.pdf
2: What Happens to Bonds When Interest Rates Rise? Charles Schwab & Co., Inc. March 7, 2023. https://www.schwab.com/learn/story/what- happens-to-bonds-when-interest-rates-rise
3: Market cap weight and performance returns provided by Koyfin. www.koyfin.com.
4: S&P 500 market cap performance measured using iShares Core S&P 500 ETF (symbol: IVV). S&P 500 equal weight performance measured using Invesco S&P 500 Equal Weight ETF (symbol: RSP). NASDAQ 100 market cap performance measured using Invesco QQQ Trust ETF (symbol: QQQ). NASDAQ 100 equal weight performance measured using Direxion NASDAQ 100 Equal Weighted Index ETF (symbol: QQQE). Performance returns provided by Koyfin. www.koyfin.com.
5: Index returns are for illustrative purposes only and do not represent actual performance of any investment. Index performance returns do not reflect any management fees, transaction costs or expenses. Indexes are unmanaged and one cannot invest directly in an index. The Standard & Poor’s (S&P) 500 Index tracks the performance of 500 widely held, large-capitalization U.S. stocks. The MSCI All Country (AC) World ex U.S. Index tracks global stock market performance that includes developed and emerging markets but excludes the U.S. The Bloomberg U.S. Aggregate Bond Index is a broad-based fixed-income index used by bond traders and the managers of mutual funds and exchange-traded funds (ETFs) as a benchmark to measure their relative performance
6: Index returns provided through Envestnet Tamarac, underlying data provider: Thomson Reuters.