
Overview
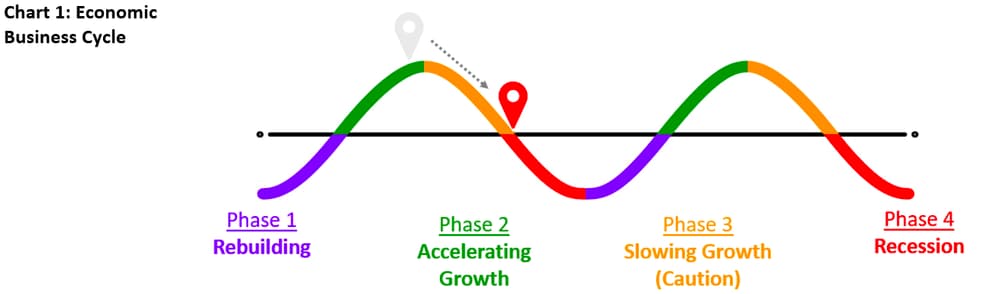
- The business cycle has rapidly shifted from rebuilding to slow growth and likely recession.
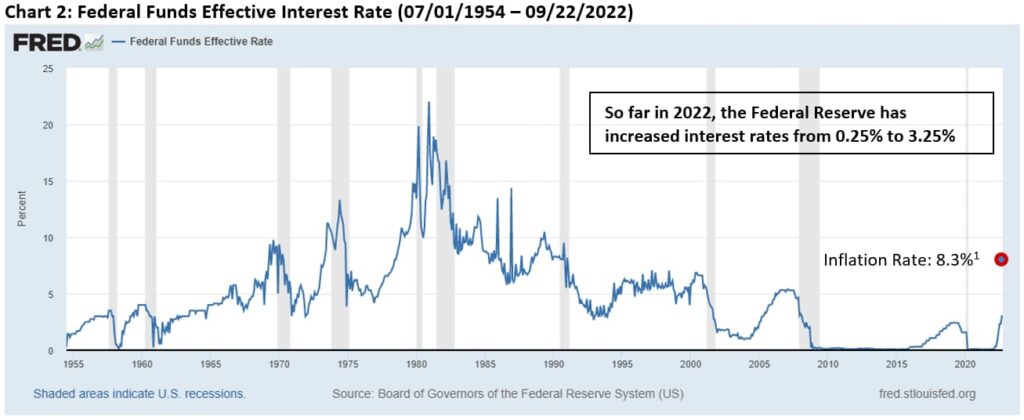
- Central banks around the world are raising interest rates in an attempt to contain stimulus infused inflation.
- In the near term, both stock and bond prices are likely to remain under pressure while corporate earnings reset.
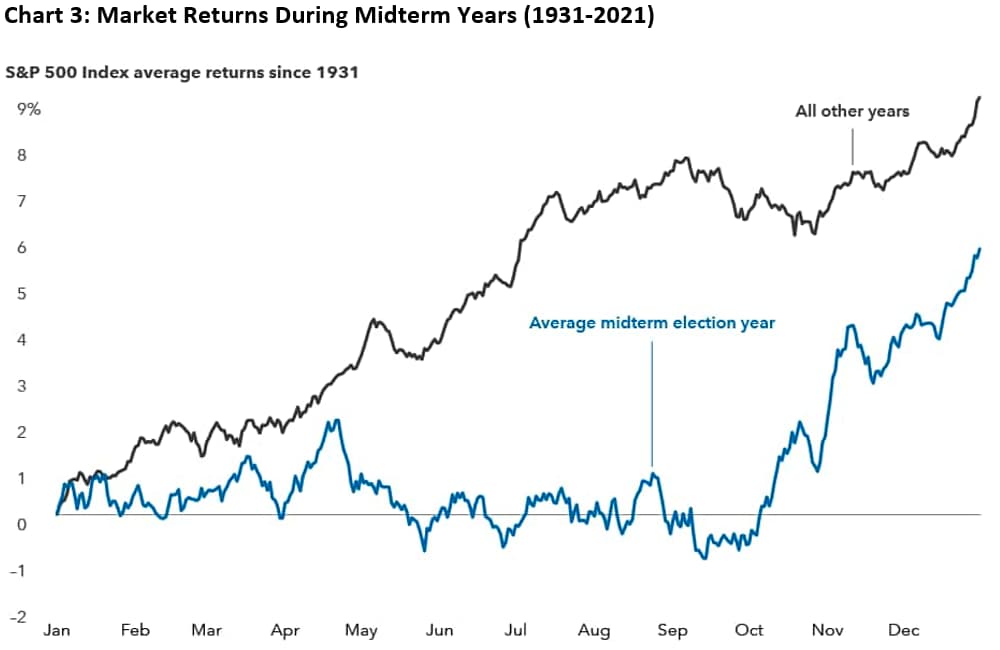
- Compared to all other years, those with a midterm election have historically provided increased volatility. Importantly, most of the annual performance occurs during the last quarter of the year.
Since the beginning of 2022, the economy rapidly migrated from accelerating growth to slow growth, and arguably a recession. The delayed reaction to an over-stimulated economy has resulted in an effort to combat inflationary pressures. This is occurring at the same time the world continues to normalize from the economic hardship produced by the pandemic. Early in the year, we were contemplating the benefits of economic improvement through the return of balance to the forces of supply and demand for goods and services. Government actions at home and abroad, Russia’s invasion of Ukraine and the energy crisis that ensued altered the trajectory of economic improvements and ignited the fuse for economic slowdown.
Central banks around the world, including the Federal Reserve, have been adjusting to the inflationary environment by aggressively increasing interest rates. In the Fed’s most recent actions on September 21st, rates were increased an additional 0.75%, bringing total rate increases to 3% so far this year. Financial markets had up until this point weighed the possibility of a soft-landing for the economy and thus preventing recession. However, through actions and words, it has become clear that the Federal Reserve is committed to aggressively increasing interest rates and as a result will likely bring the US and global economy into recession. A couple of key statements from Federal Reserve Chairman Jerome Powell’s recent press conference:
We are moving our policy stance purposefully to a level that will be sufficiently restrictive to return inflation to 2 percent.
We are taking forceful and rapid steps to moderate demand so that it comes into better alignment with supply. Our overarching focus is using our tools to bring inflation back down to our 2 percent goal and to keep longer-term inflation expectations well anchored. Reducing inflation is likely to require a sustained period of below-trend growth, and there will very likely be some softening of labor market conditions.
It is important to note that while the global economy continues to digest the increasingly restrictive interest rate environment, remember that financial markets are forward-looking. With news on the economy continuing to be negative for some time, stock markets around the world will nonetheless begin to anticipate a time where a pause in interest rate increases begins (and the likely scenario of rates retracing their steps lower).
Timing the precise moment of this inflection point is impossible; however, an important data point for the current economic cycle is US midterm elections. Revisiting a topic discussed in our January Market Outlook, compared to all years, those including a midterm election tend to bring increased market movement (volatility) and lower returns in the months preceding the elections. Once visibility is perceived on the direction of government, US stock markets tend to perform well in the months and one-year following mid-term elections.
The current bear-market environment, defined by a period where stock market indexes fall 20% from their previous highs, has been challenging for investors across nearly all investable asset classes. On average, our actions this year have been to increase cash levels within most accounts as well as reducing the average maturity of bonds along with increasing the weight of municipal bonds in taxable accounts. In addition, we have continued our work from 2021 to evaluate growth prospects of each individual investment within the portfolio, including the trimming or outright sale of certain positions based on market conditions. It is a common assumption during periods like this that all stock investments are down for the year which is not accurate. In some instances, we have taken gains from companies that have performed well during this downturn and offset those gains with losses from other areas of the portfolio. Overall, we maintain our mindfulness of capital gains during this difficult calendar year.
As uncertainty remains in the financial markets and is likely to persist a while longer, we are encouraged by the prospect of more compelling corporate valuations and a scenario where investors are rewarded for their allocation to stocks and bonds. This period will present itself again in the near-future which we are eager and prepared to respond to.
Year-to-date index performance through September 30, 2022:
| Asset Class | Index Name2 | YTD%3 |
|---|---|---|
| US Equity | S&P 500 | (23.9) |
| International Equity | MSCI All Country World Ex-US | (26.5) |
| US Fixed Income | Bloomberg Barclays US Aggregate Bond | (14.6) |
Investments may fluctuate in value. Investing involves risk including the possible loss of principal. Past performance does not guarantee future results.
This material contains an assessment of the market and economic environment at a specific point in time and is not intended to be a forecast of future events, or a guarantee of future results. Forward-looking statements are subject to certain risks and uncertainties. Actual results, performance, or achievements may differ materially from those expressed or implied. Information is based on data gathered from what we believe are reliable sources.
(1) U.S. Bureau of Labor Statistics, Consumer Price Index for All Urban Consumers (CPI-U) – U.S. city average, August 2022. https://www.bls.gov/news.release/cpi.t01.htm
(2) Index returns are for illustrative purposes only and do not represent actual performance of any investment. Index performance returns do not reflect any management fees, transaction costs or expenses. Indexes are unmanaged and one cannot invest directly in an index.
(3) Index returns provided through Envestnet Tamarac, underlying data provider: Thomson Reuters.
The Standard & Poor’s (S&P) 500 Index tracks the performance of 500 widely held, large-capitalization U.S. stocks.
The MSCI All Country (AC) World ex U.S. Index tracks global stock market performance that includes developed and emerging markets but excludes the U.S.
The Bloomberg Barclays U.S. Aggregate Bond Index is a broad-based fixed-income index used by bond traders and the managers of mutual funds and exchange-traded funds (ETFs) as a benchmark to measure their relative performance.