
Key Takeaways
- The Federal Reserve projects multi-year US GDP growth below long-term trend as inflation remains elevated and concerns emerge about employment conditions.
- The rate cutting cycle has begun; investors may benefit from higher long-term bond yields as policy outlook evolves.
- Market leadership has broadened globally in 2025, with technology, industrials, and utilities outperforming while health care and staples lag. Earnings growth is expected to continue in 2026.
- The market’s heavy concentration in mega-caps like Nvidia and Apple influences index returns, creating both risks and opportunities as investors rotate toward international markets and other US sectors for diversification.
The U.S. economy is slowing:
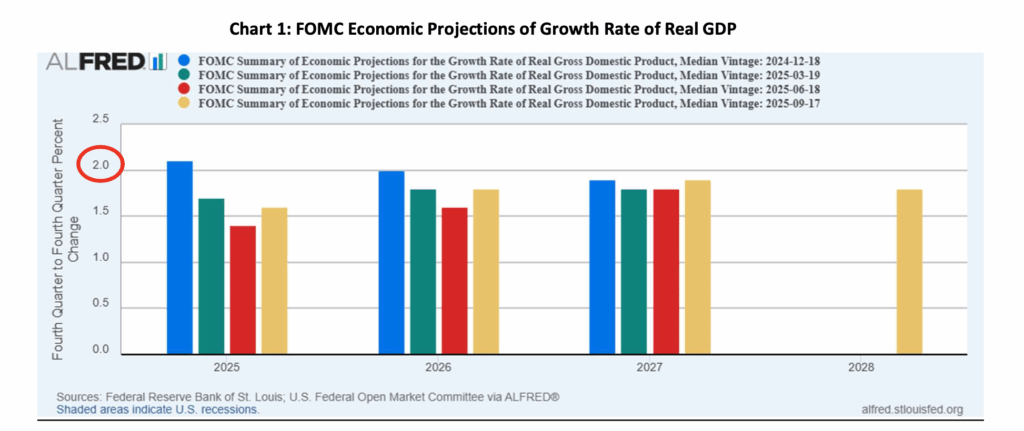
Following robust Gross Domestic Product (GDP) growth in the second quarter—the total value of goods and services produced in the economy—economic momentum appears to be settling into slower growth as we move through the second half of 2025. Consumption was likely pulled forward in anticipation of a higher and uncertain tariff environment as trade policy continues to regularly evolve.
Represented by the yellow bar in Chart 1 below, the Federal Reserve officials project GDP growth to slow to just 1.6% for the full year 2025, down from earlier estimates, with growth expected to remain below the long-term trend of 2% through 2028. This deceleration reflects several key challenges facing the economy today including both fiscal and monetary policy.
The data dependent Federal Reserve faces a delicate balancing act in the months ahead. While recent rate cuts signal concern about employment conditions, persistent inflation above target levels limits the central bank’s flexibility.
Navigating the current rate cutting cycle:
In September, the Federal Open Market Committee (FOMC) initiated its first rate cut of the year, reducing the federal funds rate—the overnight lending rate between banks—by 0.25 percentage points to a range of 4.0% to 4.25%. This marked the beginning of what many expect to be a gradual easing cycle, with Fed officials projecting the federal funds rate will decline to approximately 3.6% by the end of 2025 and reach 3.1% by 2027.
The Fed’s decision reflects a changing balance between their dual mandates of maintaining price stability (average inflation target of 2%) and supporting full employment. While the Fed’s preferred measure of inflation, the personal consumption expenditures (PCE), remains above the 2% target at 2.7% in August, weakening labor market conditions have prompted policymakers to shift to prioritize supporting economic growth and employment over inflation management. The unemployment rate has risen to 4.3% as of August 2025 marking the highest level since October 2021. While this remains historically low, the upward trend has caught policymakers’ attention.
Bond yields have responded to these policy changes with significant movement across different maturities. The yield curve—which plots interest rates across various time periods—has steepened, meaning the difference between short- term and long-term rates has increased. The 10-year Treasury yield has remained elevated near 4.2%, reflecting investor concerns about future inflation and fiscal policy, while shorter-term yields have started to decline with Fed rate cuts. Income-focused portfolios should consider taking advantage of higher long-term rates if increased meaningfully from current levels by investing more in longer-dated bonds to capture higher yields.
Stock Market Performance: Broadening Beyond US Technology
A refreshing development this year has been the broadening of market leadership beyond the technology sector that has dominated returns in recent years. AI infrastructure buildout along with aerospace and defense spending have lifted companies within the industrials and utilities sectors, joining technology and communications sectors in providing above market returns.
International markets have also continued to provide long-awaited outperformance compared to U.S. securities. This dynamic reflects several factors: a weakening U.S. dollar, which benefits foreign investments when converted back to dollars; improving economic fundamentals in many global economies; and investor rotation away from concentrated U.S. positions toward more diversified global allocations.
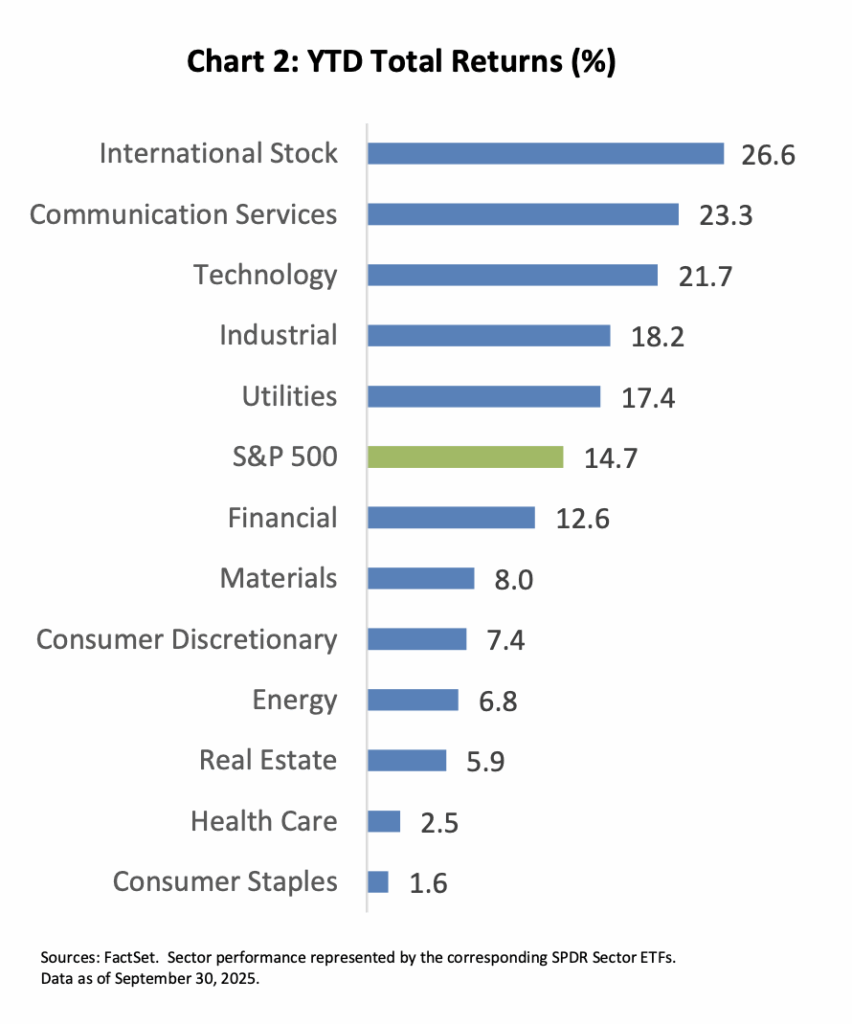
As seen in Chart 2 to the right, the consumer staples and health care sectors that led the market at the beginning of the year have generated a total return of 1.6% and 2.5% respectively year-to-date, underperforming the broader market substantially. This weakness reflects ongoing pressures from rising costs, workforce shortages, and in health care specifically, regulatory uncertainties affecting the industry.
Valuations throughout the US markets continue to remain elevated, yet as we look ahead to 2026, earnings growth is expected across the market cap spectrum. We are keeping a close eye on shifts in trends that may warrant portfolio reallocations.
The US Market isn’t as diversified as it once was:
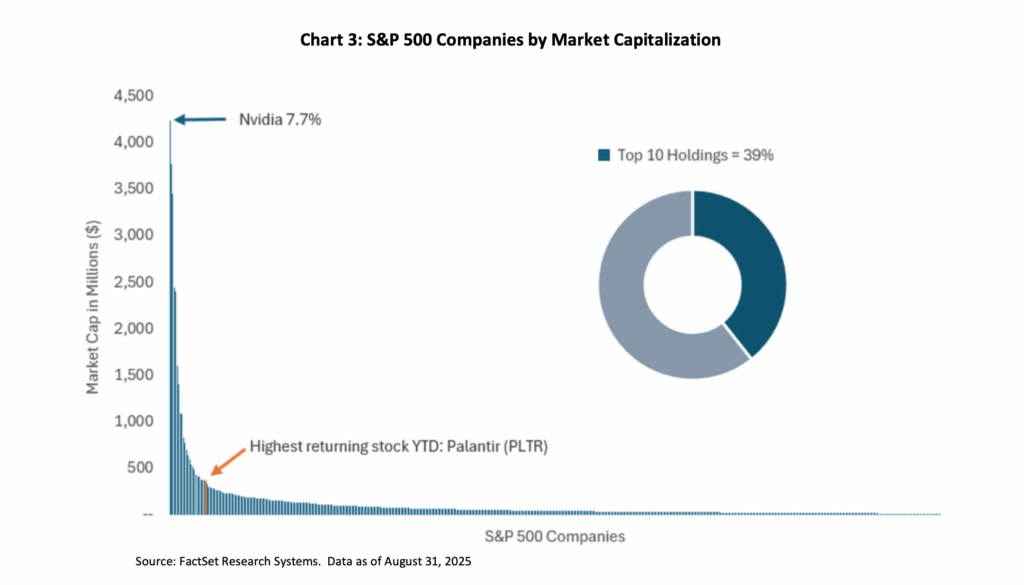
Today’s stock market faces a significant concentration challenge that differs markedly from historical norms. The top 10 companies now represent approximately 39% of total market capitalization in the US, creating an environment where a handful of stocks drive overall market performance. Nvidia exemplifies this phenomenon perfectly. Despite ranking only 67th in total returns among S&P 500 stocks as of August 31, 2025, the AI and GPU giant’s massive $4.4 trillion market capitalization (roughly 7.7% of the entire S&P 500) has contributed the most to the S&P 500’s returns for the year. To put this scale in perspective, Nvidia alone is now worth more than the entire GDP of major economies like Japan ($4T), the UK ($3.6T), and Canada ($2.2T).
Apple on the other hand, the third largest company at a 6.3% weight of the S&P 500, detracted the most from the index’s performance given its negative return, even though there were about 100 companies who have posted worse performance for the same period. Palantir, the highest returning stock, has been additive to index performance, although not as meaningfully due to its smaller representation in the index. Market-cap weighting can create situations where size, rather than performance, determines influence on portfolio returns—both to the upside and downside.
This concentration offers both risks and rewards for investors seeking long-term value creation. Throughout the year, we have expanded our stock market exposure to include broad sector funds in areas where valuations may be more attractive and growth potential underappreciated.
The market’s ongoing rotation away from concentrated US large-cap technology companies is creating opportunities in international markets, value-oriented companies, and small-cap stocks; areas that may benefit as investors seek diversification beyond the mega-cap names that have dominated recent years. This broadening market dynamic requires careful security selection, as not all sectors and regions will benefit equally from these shifting conditions.
In closing:
As 2025 comes to a close, the investment landscape presents both opportunities and challenges for investors. Economic growth remains positive but is slowing, the Federal Reserve has begun cutting interest rates while inflation persists above target, and markets are showing signs of broadening beyond their previous narrow leadership. Bond markets continue to offer attractive yields with the potential for price appreciation as monetary policy eases.
We believe success in this environment depends on maintaining diversified exposures, emphasizing quality investments, and remaining flexible as conditions evolve. While uncertainty always exists in financial markets, understanding current trends and maintaining a long-term perspective can help investors navigate these complex conditions successfully.
As always, investors should consider their individual circumstances, risk tolerance, and investment timeframes when making portfolio decisions. Please reach out to your advisor with any questions you may have or if you would like to discuss the appropriate asset allocation within your accounts, we would enjoy connecting with you before year-end.
We wish you a joyful holiday season and many memorable moments in the months ahead!
Investments may fluctuate in value. Investing involves risk including the possible loss of principal. Past performance does not guarantee future results.
This material contains an assessment of the market and economic environment at a specific point in time and is not intended to be a forecast of future events, or a guarantee of future results. This material is for educational purposes only and should not be considered as investment advice or a recommendation to buy or sell any specific securities. Forward-looking statements are subject to certain risks and uncertainties. Actual results, performance, or achievements may differ materially from those expressed or implied. Information is based on data gathered from what we believe are reliable sources. Please consult with a qualified financial advisor before making investment decisions.
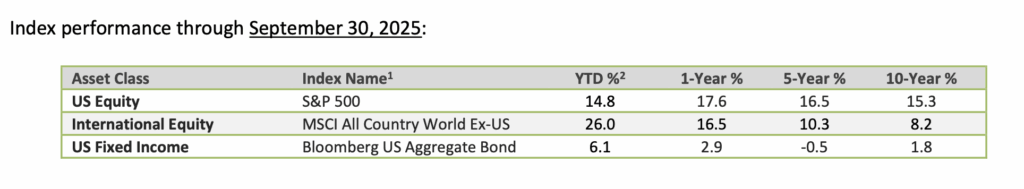
1Index returns provided through Envestnet Tamarac, underlying data provider: Thomson Reuters.
2Index returns are for illustrative purposes only and do not represent actual performance of any investment. Index performance returns do not reflect any management fees, transaction costs or expenses. Indexes are unmanaged and one cannot invest directly in an index. The Standard & Poor’s (S&P) 500 Index tracks the performance of 500 widely held, large-capitalization U.S. stocks. The MSCI All Country (AC) World ex U.S. Index tracks global stock market performance that includes developed and emerging markets but excludes the U.S. The Bloomberg U.S. Aggregate Bond Index is a broad-based fixed-income index used by bond traders and the managers of mutual funds and exchange-traded funds (ETFs) as a benchmark to measure their relative performance