
Emerging market (EM) stocks have had a rough decade. For the ten years ended November 29, 2019, EM equities produced an annualized return of 3.3%, badly lagging the 8.6% annualized return of the world stock market and the 12.7% return of the US stock market1. In light of this poor performance stretch, many investors have become disillusioned with the asset class2 and believe that emerging markets will continue to underperform going forward. In investing, some of the most attractive long-term opportunities arise when negative sentiment becomes widespread and expectations for the future are low. We believe this is the case for EM stocks today.
In this paper, we go back to the fundamentals of the emerging markets investment story. First, we define EM and provide an overview of the emerging markets investment universe. Next, we outline the investment case for EM stocks, which we believe to be highly compelling at this time.
What is an Emerging Market?
In the investing world, the term emerging market generally refers to middle income countries whose level of economic development has not yet attained the level of developed markets, such as the US, Canada, Japan, Australia and most of Europe. Emerging markets tend to have faster levels of economic growth and population growth than developed markets and they also typically have younger populations. On the other hand, their governmental institutions are generally considered to be weaker than those of developed countries. In addition, corporate governance standards in most emerging markets are not as robust as they are in the developed world3.
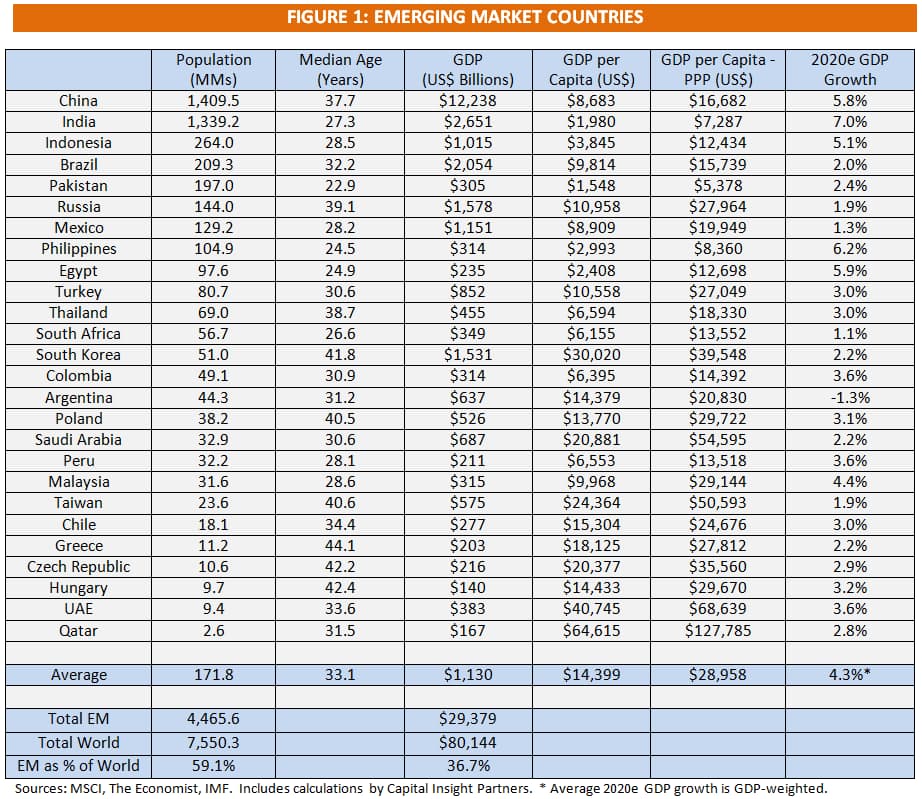
While there is no one single definition for an emerging market, for over 30 years MSCI’s Emerging Markets Index has been a key reference point for the investing community. The number of countries in MSCI’s EM Index has expanded considerably since its launch in 19874, reflecting the overall growth of developing economies around the world and the expansion of their capital markets. In addition, the index has varied over time in response to the rising and falling fortunes of particular countries. Today, the MSCI EM Index consists of 26 countries. Figure 1 below summarizes a few key statistics for these 26 economies.
In analyzing the data in figure 1, several key points stand out. The first is the dominant role of China and, to a lesser extent of India, within emerging markets. These two countries alone account for over 50% and 60% of EM GDP and population, respectively. Another key point is that emerging markets constitute a very heterogeneous set of countries, particularly with regard to their level of economic development. For example, India (GDP per capita of ~$2,000), Mexico (GDP per capita of ~$9,000), the Czech Republic (GDP per capita of ~$20,000), South Korea (GDP per capita of ~$30,000) and the United Arab Emirates (GDP per capita of ~$40,000) are all considered emerging markets. Finally, the data shows how significant emerging markets are to the global economy. Collectively, emerging markets account for 37% of the world’s GDP (on a purchasing power parity, or PPP, basis this percentage exceeds 50%4 and 59% of its population.
Emerging market growth has slowed somewhat in recent years due to both structural and cyclical factors, yet EM economies remain the main engine of the world’s economic growth. For 2020, the International Monetary Fund (IMF) expects the 26 emerging market countries in figure 1 to grow GDP by 3.1% on average. However, on a GDP-weighted basis, 2020 projected GDP growth for EM is 4.3%. In contrast, the IMF expects advanced economies to grow GDP by only 1.7% in 2020. Within EM, Asia is clearly the key driver of growth. For example, most of the larger 5%+ GDP growth economies in EM and the world are in Asia, including China (5.8%), India (7.0%), Indonesia (5.1%) and the Philippines (6.2%).
The Emerging Markets Investment Universe
The MSCI Emerging Markets Index captures the largest, most investable companies in EM and as such we can think of it as a proxy for the EM equity universe. However, it should be noted that this index is far from an all-inclusive measure of EM stocks. For example, there are thousands of publicly-traded companies in EM that are not in the index.
As of November 2019, the MSCI EM Index consisted of 1,410 companies with a free-float adjusted market capitalization6 of US$5.7 trillion. This represents about 12% of global free-float adjusted stock market capitalization. While this is a meaningful percentage, it arguably understates the relevance of EM within the global stock market. For example, based on total market capitalization, emerging markets account for 24% of the world’s equity market7.
Let’s now turn to the composition of the MSCI EM Index from a few perspectives.
Figure 2 shows the index’s composition in terms of country weights. China is by far the largest country with a weight of 34.0%. It is followed by Taiwan at 11.7%, South Korea at 11.6%, India at 9.1% and Brazil at 7.2%. In the aggregate, Asia dominates the index with a total weighting of close to 75% with other regions, including Latin America and Eastern Europe, having a much smaller overall contribution.
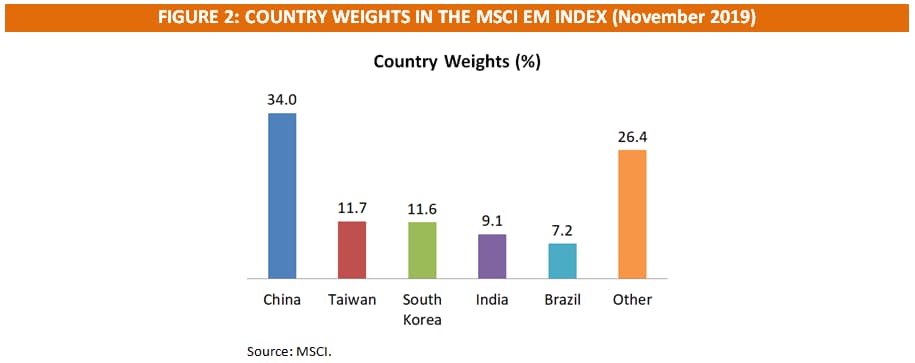
The weight of China in the EM index has increased recently and is poised to increase further as a result of an important change in MSCI’s methodology over the past few years. Historically, the EM index only included Chinese stocks that traded on the Hong Kong Stock Exchange (these are referred to Chinese H-shares) and on US and other foreign stock exchanges. However, starting in May 2018, MSCI began a phased process of including China A-share stocks, that is Chinese stocks listed on the mainland Shanghai and Shenzhen stock exchanges, in the EM index. The China A-share universe is extremely large with 3,600 stocks and an estimated market capitalization of about US$8 trillion8. While it is unclear exactly what percentage of China-A shares will ultimately be included in the EM index, China’s weight could increase to over 40% over time according to MSCI9.
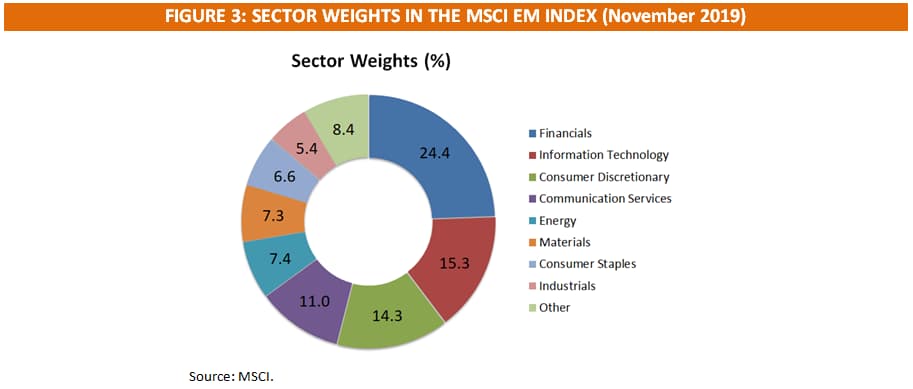
Now turning to the sector composition of the MSCI EM Index (see figure 3 below), as of November 2019, the largest sectors in the index were Financials (24.4%), Information Technology (15.3%), Consumer Discretionary (14.3%) and Communication Services (11.0%).
Over the past five to ten years, the relative importance of the Technology sector has increased meaningfully in the MSCI EM Index. Historically, natural resource sectors were much more prominent but today this is no longer the case. If we include Communications Services alongside Information Technology, the total weighting of Technology-related sectors in the EM Index is currently over 26%. In comparison, the equivalent percentage for the S&P 500 Index in the United States is approximately 33%.
At a weighting of 24.4%, the Financials sector is much more prominent in the MSCI EM Index than it is in the US stock market. In the S&P 500 Index, the current weighting of the Financials sector is 13.1%. Conversely, the Industrials sector is less prominent in the EM Index with a weighting of 5.4%. This compares to a weighting for the sector of 9.4% in the S&P 500 Index.
To briefly recap, the EM investment universe is vast in terms of the total number of companies and total market capitalization even if we just consider the MSCI EM Index. Within EM, China and Asia are clearly the most important market and region, respectively, for investors. Finally, from a sector perspective, EM is much more broadly diversified than it was historically with Financials and Technology-related sectors playing a very important role today.
The Investment Case for Emerging Market Stocks
We believe that investors should have a long-term strategic allocation to emerging market stocks and that this asset class is an important part of a well-diversified global portfolio. In addition, as we have seen, EM stocks considerably expand the investment opportunity set given the size of the EM stock universe. Beyond this, we see a compelling investment case for EM stocks based on several key themes and other considerations.
Growth of the EM Consumer and Middle Class
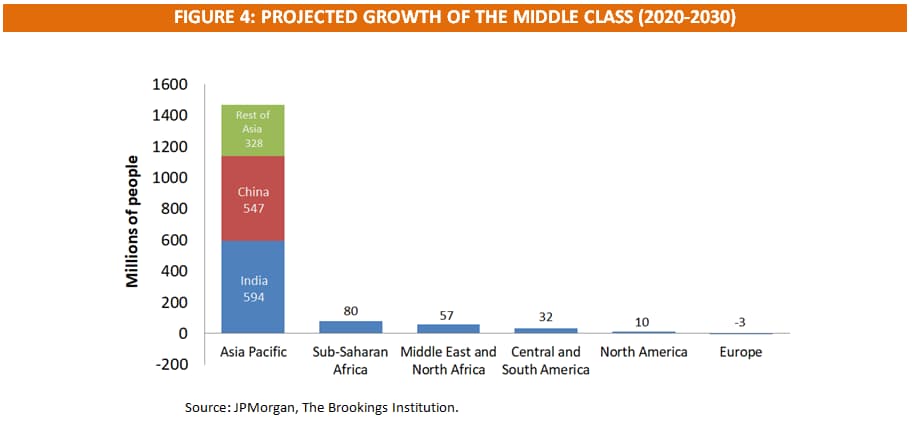
The EM consumer story is certainly not a new theme but it remains a highly compelling rationale for investing in emerging markets in our view. As emerging markets continue to develop, the middle class is expanding significantly across large parts of the emerging world. According to research from the Brookings Institution and JPMorgan, almost all of the growth of the middle class during the next decade will come from emerging markets (see figure 4 below)10. Most notably, around 1.5 billion people are expected to enter the middle class in Asia over the next ten years. Sectors such as Consumer Discretionary and Consumer Staples should be direct beneficiaries of this theme. In addition, sectors such as Technology and Financials should also benefit as the growth of the middle class leads to greater spending on a wide range of products and services.
The China & Asian Technology Story
Asia and particularly China have been investing heavily in technology and R&D for many years and they are rapidly moving up the curve in terms of global technological competitiveness and innovation. Some of the largest technology companies in the world today are located in Asia, including Samsung (South Korea), Alibaba (China), Tencent (China) and Taiwan Semiconductor Manufacturing (Taiwan) and there are many leading private technology companies in the region as well.
China has focused significant attention in recent years on several next-generation technologies, including artificial intelligence (AI) and virtual reality (VR)/augmented reality (AR). In AI, China is arguably already one of the world leaders in this field. For example, in 2018, China filed more than 30,000 public patents for AI, or about 2.5 times more than the US. In addition, China’s public AI patents have jumped by a factor of ten in about 5 years11.
One interesting feature of China’s technology sector is that certain segments of the market are evolving quite independently from the US and other countries. Perhaps the best example of this phenomenon is the evolution of China’s payments system. China effectively leap-frogged the US card-based system and most payments in China today occur digitally through the use of smartphones and QR codes. In fact, in China’s largest cities, over 90% of the population use digital payments as their primary payment system with cash second and cards a distant third12.
We believe that the growth and evolution of China’s technology sector will provide investors with many attractive investment opportunities. Investors that directly invest in Chinese-based companies (and by extension in emerging markets) will be best positioned to fully capture these opportunities in our view.
Compelling Valuations
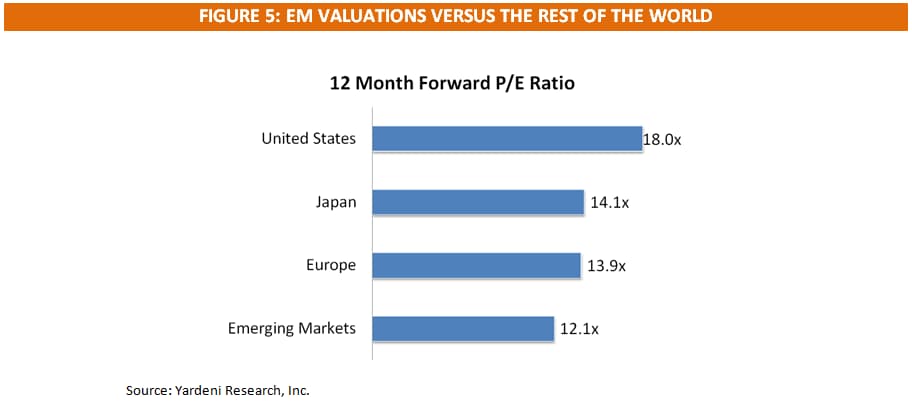
EM valuations are very attractive today in our estimation based on most metrics. For example, as can be seen in figure 5, on a forward P/E basis, EM stocks currently trade at a very sizable discount to US stocks and at a meaningful discount to developed international stocks. EM stocks are also trading at a discount to their own historical valuation averages on several measures.
In the short-term, the attractive valuations of EM stocks may not necessarily translate into improved performance for the group. In fact, EM stocks have been attractively valued for some time now yet have continued to underperform. However, valuations matter greatly in the long-term, and taking a long-term perspective we believe investors will be well served by purchasing EM stocks at current valuation levels.
US vs International Performance is Cyclical
In a prior white paper13, we discussed how the returns of US and International stocks tend to be similar over long periods of time but that historically, there have been alternating cycles where either US or International stocks (including emerging markets) have clearly outperformed the other. Since 2009, US stocks have dramatically outperformed International stocks in what has been a usually long cycle of US stock outperformance. Based on history, we think that the current cycle will turn eventually and that International and EM stocks may enter a multi-year period of outperformance.
In Conclusion
Emerging markets are an essential part of the global economy and the global financial markets. They represent close to 60% of the world’s population, 40% of global GDP and 25% of the global stock market. Given the vast investment opportunity they represent, we consider emerging market equities to be a core part of a global portfolio.
There are many compelling reasons to invest in EM stocks, including both growth and diversification benefits. In addition, there are numerous attractive structural trends or themes in emerging markets. These include the expansion of the middle class and the growth of the Chinese and Asian technology sector.
We think this is a particularly opportune time to invest in EM stocks. After a decade of underperformance, overall sentiment towards the asset class has become negative and expectations for the future are low. Current valuations are attractive and we think that long-term oriented investors that purchase EM stocks today will be rewarded over time.
At Capital Insight Partners, we have historically had a meaningful allocation to EM equities based on the favorable long-term trends we see in these markets. In recent periods, however, we have been increasing our exposure to emerging markets in client portfolios based on the compelling opportunity that we see. While EM investments are a smaller part of our client portfolios relative to the size of US investments, we anticipate that the percentage allocated to EM will continue to grow over time.
(1) The performance of EM stocks refers to the return of the MSCI Emerging Markets Index. The performance of the world stock market refers to the performance of the MSCI All-Country World Index. The return of the US stock market refers to the return of the S&P 500 index. Sources: MSCI and S&P Dow Jones.
(2) Technically, emerging market stocks are a sub asset class or segment of the broader equity asset class.
(3) Beyond emerging markets, there is another group of developing economies that are generally known as frontier markets. This group of countries includes economies such as Vietnam, Bangladesh, Kenya, Morocco, Romania and Kazakhstan, among others. Frontier markets are lower income countries that have not yet become middle income economies and whose financial market development has not yet attained the level of emerging markets.
(4) MSCI, “The Future of Emerging Markets.”
(5) There are two measures of GDP per capita that are commonly used. The first, nominal GDP, does not account for differences in costs across countries. The second, GDP per capita on a purchasing power parity (PPP) basis, does. Both measures are important in our view in assessing the relative size of different economies.
(6) Total market capitalization is based on the value of all of a company’s shares outstanding. Free-float adjusted market capitalization on the other hand is based on a company’s shares that are generally available for trading in the public markets. In emerging markets, it is common for founding families, the government or other strategic investors to own meaningful stakes in many publicly-traded companies. These shares are generally excluded from free-float adjusted market capitalization. As a result, there is a sizeable difference in EM between total market capitalization and free-float adjusted market capitalization.
(7) MSCI, “The Future of Emerging Markets.”
(8) Source: BNP Paribas.
(9) MSCI, “The Future of Emerging Markets.”
(10) JPMorgan, “Reemergence of EM Equities: The Dawn of the EM Consumer.”
(11) Source: Nikkei Asian Review.
(12) Source: The Brookings Institution.
(13) Please refer to the December 2017 edition of Capital Insight Partners’ Investment Perspectives (Overcoming Home Bias: The Case for International Investing).

